Home Assistant’s built-in history graph and gauge cards get the job done, but they’re fairly plain. Mini Graph Card by kalkih is one of those HACS cards that immediately makes your dashboard look like something you’d actually want to show people - dynamic colour thresholds, dual Y-axes, configurable aggregation, and a clean minimal design.
In this post I’ll walk through installing it via HACS, then build up a card that shows SwitchBot temperature and humidity data with colour-coded thresholds and both sensors on the same tile. If you’ve not yet got your SwitchBot sensors talking to Home Assistant, start with my earlier post on ESPHome Bluetooth proxies - that covers the sensor setup end to end.
Prerequisites
- Home Assistant (any install method - the card itself is install-agnostic)
- SwitchBot Meter Plus or Indoor/Outdoor Thermo-Hygrometer already added as entities in HA (via the SwitchBot Bluetooth integration - no Hub required)
- HACS installed. If you haven’t done this yet, follow the official guide at hacs.xyz - it’s a one-time setup that takes about five minutes
Installing Mini Graph Card via HACS
- Open HACS from the Home Assistant sidebar.
- Click Explore & Download Repositories (the orange + button, bottom-right).
- Search for
mini-graph-cardand select the entry by kalkih. - Click Download, leave the latest version selected, and confirm.
HACS drops the bundle at /hacsfiles/mini-graph-card/mini-graph-card-bundle.js and registers the resource automatically on modern installs.
- Restart Home Assistant (Settings → System → Restart) so the resource is loaded.
If the card doesn’t appear in the dashboard picker after restarting, check that the resource got registered: go to Settings → Dashboards → Resources and confirm there’s an entry pointing at /hacsfiles/mini-graph-card/mini-graph-card-bundle.js with type JavaScript Module. If it’s missing, add it manually with the + button. Then hard-reload your browser (Ctrl+Shift+R / Cmd+Shift+R) - this is the most common gotcha.
A Basic Temperature Card
Once installed, add a card to your dashboard. Switch to YAML mode in the card editor and paste this:
type: custom:mini-graph-card
name: Garden Temperature
entities:
  - sensor.garden_thermo_hygrometer_temperature
hours_to_show: 24
points_per_hour: 2
show:
  labels: true
  state: true
Replace sensor.garden_thermo_hygrometer_temperature with your actual entity ID (check it in Settings → Devices & Services → your SwitchBot device).
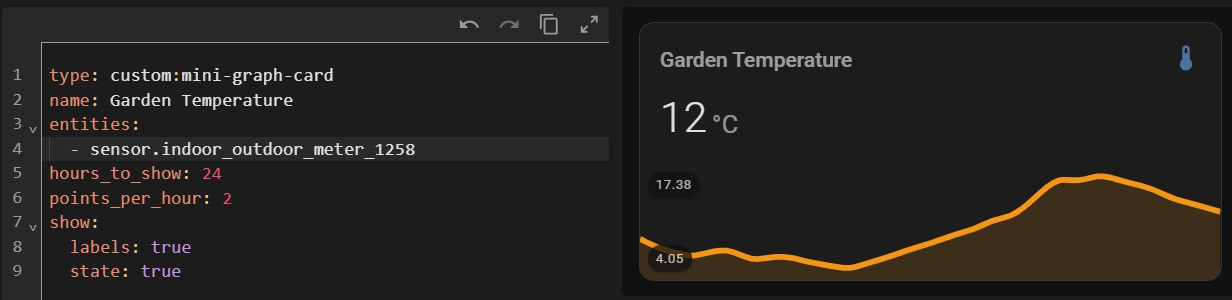
hours_to_show: 24 gives you the last 24 hours of history; points_per_hour: 2 averages the readings into 30-minute buckets, which keeps the line smooth without losing meaningful detail. Crank it up to points_per_hour: 12 if you want near-real-time resolution.
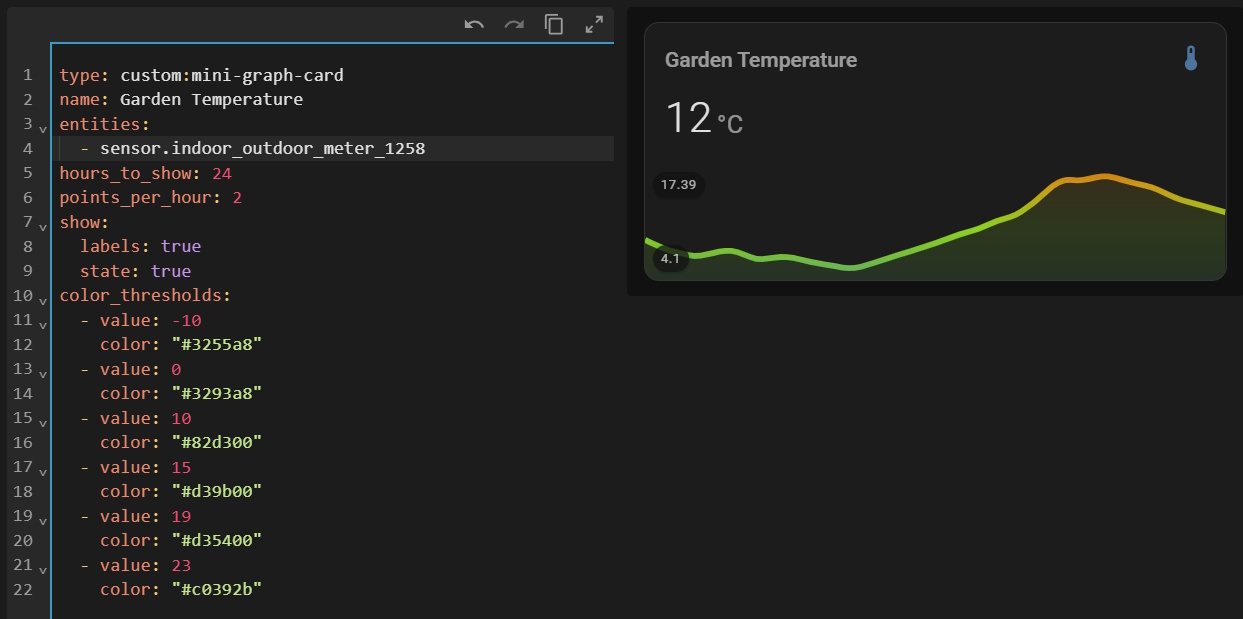
Adding Colour Thresholds
This is where mini-graph-card earns its keep. The color_thresholds option lets you define value-to-colour mappings - the graph line colour shifts as the sensor crosses each threshold.
type: custom:mini-graph-card
name: Garden Temperature
entities:
  - sensor.garden_thermo_hygrometer_temperature
hours_to_show: 24
points_per_hour: 2
show:
  labels: true
  state: true
color_thresholds:
  - value: -10
    color: "#3255a8"
  - value: 0
    color: "#3293a8"
  - value: 10
    color: "#82d300"
  - value: 15
    color: "#d39b00"
  - value: 19
    color: "#d35400"
  - value: 23
    color: "#c0392b"
By default, transitions between stops are smoothly interpolated (color_thresholds_transition: smooth). If you’d rather hard colour bands, add:
color_thresholds_transition: hard
Note: Thresholds are applied to the displayed line, not the individual data points - so with smooth transitions the colour blends continuously as the value moves through the defined stops.
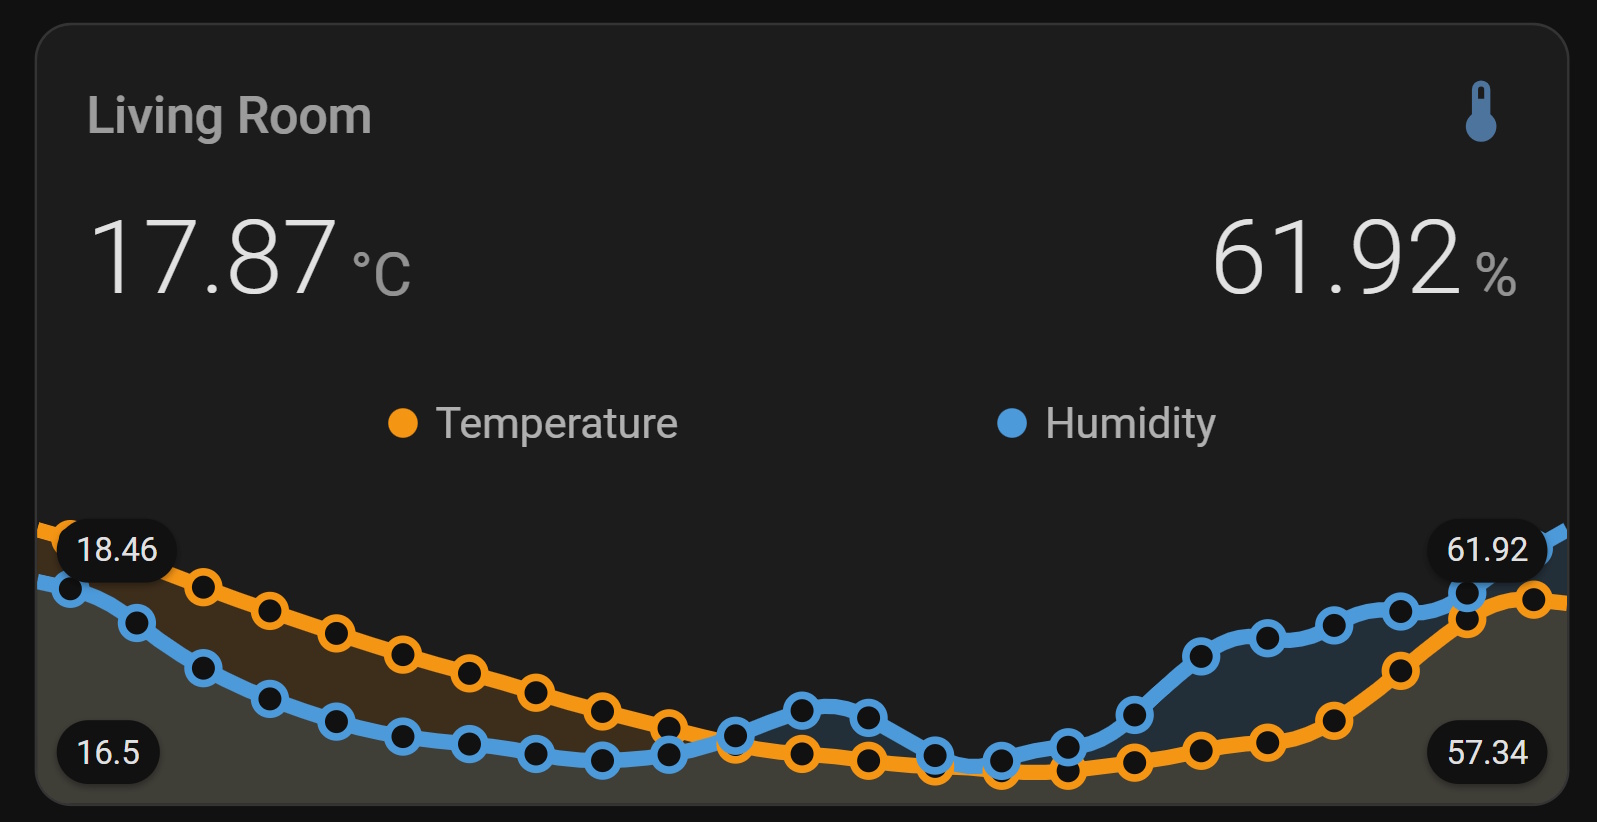
Showing Temperature and Humidity Together
SwitchBot meters expose both temperature and humidity as separate entities, and mini-graph-card can plot multiple entities on the same card. The catch is that temperature (°C, typically 0–30) and humidity (%, 0–100) live on very different scales - plotting them on the same Y-axis makes the temperature line look completely flat.
The fix is the secondary Y-axis. Assign humidity to y_axis: secondary and it gets its own right-hand scale:
type: custom:mini-graph-card
name: Garden Conditions
hours_to_show: 24
points_per_hour: 2
show:
  labels: true
  labels_secondary: true
entities:
  - entity: sensor.garden_thermo_hygrometer_temperature
    name: Temperature
    color: "#d35400"
    show:
      state: true
  - entity: sensor.garden_thermo_hygrometer_humidity
    name: Humidity
    color: "#3293a8"
    y_axis: secondary
    show:
      state: true
lower_bound_secondary: 0
upper_bound_secondary: 100
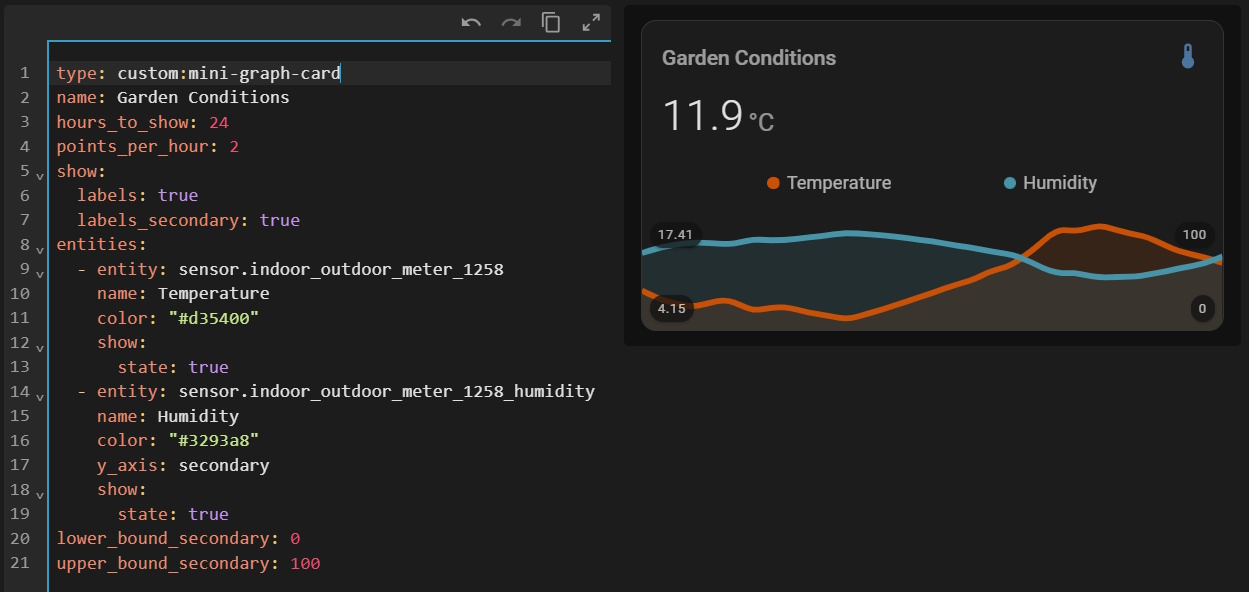
lower_bound_secondary: 0 and upper_bound_secondary: 100 pin the humidity axis to a sensible range so small fluctuations don’t get exaggerated.
Extending the Time Window
The default hours_to_show: 24 is fine for day-to-day monitoring, but for spotting trends - does it always get humid after midnight? what’s the weekly temperature swing? - longer windows are more useful.
For a week of data:
hours_to_show: 168
points_per_hour: 0.25
points_per_hour: 0.25 gives you one point every four hours, which keeps the graph readable over seven days.
For daily min/max/average on one graph, you can combine per-entity aggregate_func with group_by: date:
type: custom:mini-graph-card
name: Temperature - This Week
hours_to_show: 168
group_by: date
entities:
  - entity: sensor.garden_thermo_hygrometer_temperature
    name: Max
    aggregate_func: max
    color: "#c0392b"
  - entity: sensor.garden_thermo_hygrometer_temperature
    name: Avg
    aggregate_func: avg
    color: "#d39b00"
  - entity: sensor.garden_thermo_hygrometer_temperature
    name: Min
    aggregate_func: min
    color: "#3293a8"
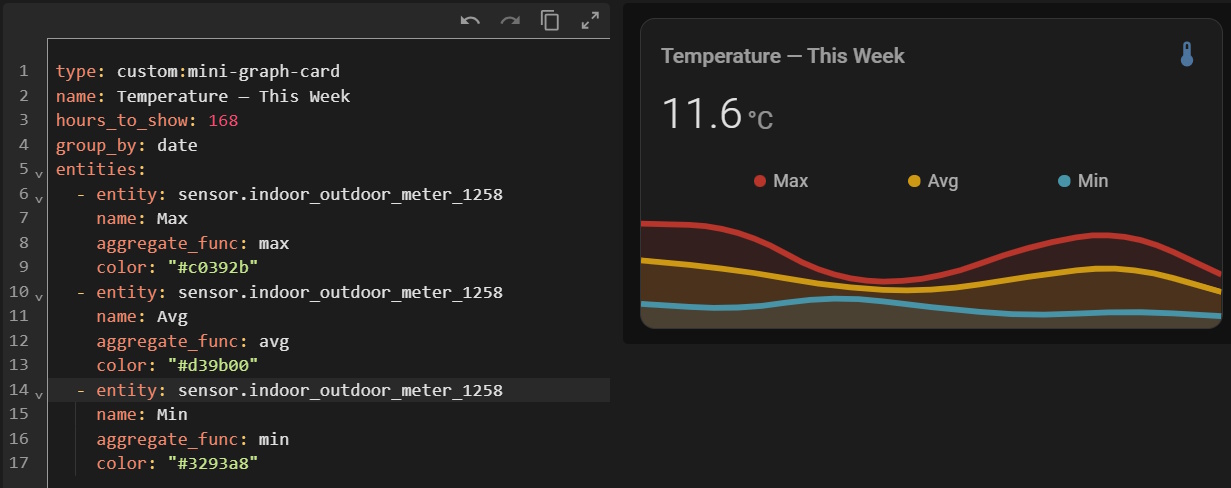
This is great for a garden or greenhouse where you want to see how wide the daily temperature swing is.
About the SwitchBot Meters
The SwitchBot Meter Plus and Indoor/Outdoor Thermo-Hygrometer both use a Swiss-made Sensirion sensor with quoted accuracy of ±0.2 °C and ±2% RH, sampling at roughly four readings per second. The outdoor model adds an IP65 rating and operates down to −20 °C (and reportedly beyond that in practice), making it a genuine outdoor sensor rather than just a weatherproofed indoor one.
Crucially, neither device needs a SwitchBot Hub to work with Home Assistant - data flows entirely over Bluetooth to HA’s SwitchBot Bluetooth integration, locally and without cloud. You only need a Hub if you want SwitchBot’s own app features like remote access, push alerts on derived metrics (dewpoint, VPD), or Matter bridging.
If your sensor is physically out of Bluetooth range - a garden sensor is a classic example - an ESP32 running ESPHome makes a cheap, reliable proxy. I covered the full setup in the ESPHome Bluetooth proxies post.
Note: Derived metrics like dewpoint and vapour-pressure deficit aren’t exposed as native HA entities by the Bluetooth integration - they’re computed in SwitchBot’s cloud. If you want them in HA, you’ll need a
templatesensor that calculates them from the temperature and humidity values.
Troubleshooting
Card shows “Custom element doesn’t exist” error The resource isn’t registered or hasn’t loaded. Check Settings → Dashboards → Resources for the mini-graph-card entry and hard-reload your browser.
Card doesn’t appear in the visual picker
Clear your browser cache - Lovelace caches frontend resources aggressively. A hard-reload (Ctrl+Shift+R) usually fixes it.
Graph is empty or shows “No state history found”
The HA recorder needs a bit of time to build up history for a new entity. If the entity itself has data (check its history in Developer Tools → States), the card will fill in over time. Also check your hours_to_show isn’t set longer than you have history for.
Humidity axis looks wrong on the dual-axis card
Make sure lower_bound_secondary and upper_bound_secondary are set at the card level (not inside an entity), and that your humidity entity is correctly assigned y_axis: secondary.
Mini Graph Card is one of those HACS installs that I put on every dashboard I build. The colour threshold feature alone is worth it - there’s an immediate visual read on whether things are in range without having to look at the numbers. Pair it with a couple of SwitchBot sensors and you’ve got decent environmental monitoring for very little outlay.
If you’re building out a home lab monitoring setup, the Uptime Kuma with Docker Compose post is worth a look for the services side of things.